Straits Times Index Stock Price Jan - Apr 2010

Date                STI                           Volume                               STI ETF

Apr  30 2010   2 ,974.61  +15.60       1.83 billion shares traded              3.000
Markets end week on positive note.

Apr  23 2010   2 ,988.49  +7.80         1.73 billion shares traded              3.000
STI buoyes by talk of Greek bailout.

Apr  16 2010   3 ,007.19  -9.75         1.85 billion shares traded               3.030
Markets fall on China's property steps.

Apr  09 2010   2 ,971.97  +8.78         2.66 billion shares traded              2.990
Upbeat US economic data cheers Asia.

Apr  01 2010   2 ,943.02  +55.56        1.42 billion shares traded             2.960
STI rebounds and surges to 21 month high.
The higher the market goes, the higher your risk as the margin of safety of stocks goes down.

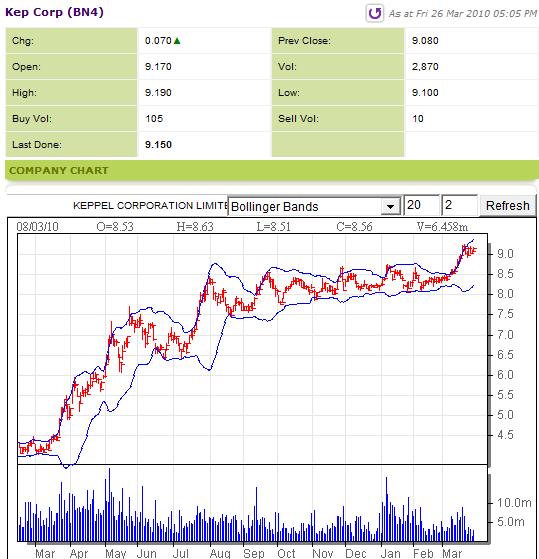
Mar 26 2010   2 ,906.28  +17.91        1.05 billion shares traded             2.940
Small stocks gain on thin volume.
Keppel Corporation technically moving in up trend after the range bond breakout.

STI Components Stock - Keppel Corporation 26 March 2010

Mar 19 2010   2 ,915.70  +1.76          1.05 billion shares traded             2.940
Last minute nose dive wipes out almost all gains on STI.

Mar 12 2010   2 ,881.36 +7.45           1.36 billion shares traded             2.900
Blue chips rise as fears of recession ease.
CapitaMalls Asia will replace Cosco Corp as a constituent of the STI from 22 March.

Mar 5 2010     2 ,790.29 +21.59         1.35 billion shares traded             2.810
Sentiment was sweetned by good news on the local corporate front and a brighter outlook internationally.

Feb 26 2010    2 ,750.86 +1.71           1.28 billion shares traded             2.790
Investors are jittery over the property sector with continuing worries that the Government will take further measures to cool the property market.

Feb 19 2010    2 ,757.14 +12.05         1.4 billion shares traded               2.780
Investors are trying to digest the US Fed decision to raise its benchmark interest rate.

Feb 12 2010    2 ,758.90 +5.27           1.21 billion shares traded             2.810
The year of the Ox ended with a whimper with investors more concerned with holiday plans than sparking any action on the market front.

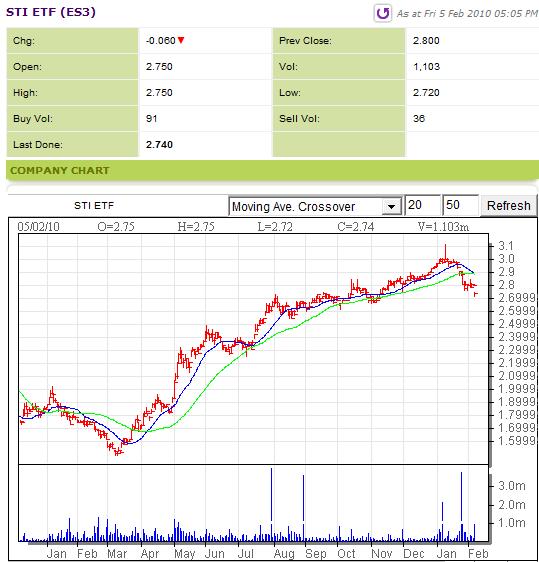
Feb  5 2010     2 ,683.56 -61.42          2.17 billion shares traded             2.740
Investor worldwide are getting jittery that the debt problems of euro zone countries such as Greece, Spain and Portugal could derail the global recovery.

Techincally, many stocks are either going sideway or trending downwards.  Technical traders normally keep away from the market during this kind of formation which is not clear and wait for stocks to trend up again.

STI ETF - Feb 5

Jan 29 2010     2 ,745.35 -12.33         1.76 billion shares traded             2.800
Spooked by China tightening of its monetary policy and United States plan to curb the size and speculative activity of banks and concerns over Greece's ability to service its debt.

Jan 22 2010     2 ,819.71 -31.27         2.89 billion shares traded             2.910
Knee jerk reaction to Wall Street plunge as the market was spooked by the scale of damage taken by US lenders after President Obama move to reforem the financial system by slicing banking business from other riskier activites such as proprietary trading and hedge.

Jan 15 2010     2,908.42 -1.10            1.68 billion shares traded             2.980

Jan   8 2010     2,922.00 -9.51           2.56 billion shares traded              2.990

Straits Times Index
Portfolio
  1. CapMallsAsia
  2. Capital Land
  3. CapitaMall
  4. CityDev
  5. ComforDelGro
  6. DBS Grp
  7. F & N
  8. Gent Intl
  9. Golder Agri
10. HK Land (USD)
11. JMH (USD)
12. JSH (USD)
13. Jardine C & C
14. Keppel Corp
15. NOL
16. Noble Grp
17. OCBC Bk
18. Olam
19. SGX
20. SIA
21. SIA Engg
22. SMRT
23. SPH
24. ST Engg
25. SembCorp Ind
26. SembMar
27. Singtel
28. Star Hub
29. UOB
30. Wilmar
   3 ,007.19 
April 16 2010
  1.    2.25
  2.    4.10
  3.    1.86
  4.   11.22
  5.    1.59
  6.  15.48
  7.    4.89
  8.    0.90
  9.    0.595
10.    5.09
11.  36.64
12.  21.30
13.  29.52
14.    9.54
15.    2.23
16.    3.13
17.    9.16
18.    2.71
19.    8.35
20.  15.52
21.    3.60
22.    2.16
23.    4.07
24.    3.30
25.    4.32
26.    4.42
27.    3.12
28.    2.42
29.  20.46
30.    6.93
    Gross Yield
April 16 2010
  1.    0.4
  2.    2.6
  3.    4.8
  4.    0.7
  5.    3.3
  6.    3.6
  7.    2.8
  8.    -
  9.    0.8
10.    3.1
11.    2.5
12.    0.9
13.    2.8
14.    4
15.    -
16.    1.6
17.    3.1
18.    1.3
19.    3.1
20.    2.6
21.    4.4
22.    3.6
23.    4.4
24.    4
25.    3.5
26.    3.4
27.    4
28.    7.9
29.    2.9
30.    1.2
   2 ,988.49
April 23 2010
  1.    2.17
  2.    3.94
  3.    1.88
  4.   10.84
  5.    1.58
  6.  15.48
  7.    4.94
  8.    0.855
  9.    0.61
10.    5.12
11.  36.06
12.  21.20
13.  29.88
14.  10.06
15.    2.15
16.    3.07
17.    8.81
18.    2.63
19.    8.35
20.  15.36
21.    3.61
22.    2.19
23.    4.15
24.    3.29
25.    4.44
26.    4.33
27.    3.14
28.    2.37
29.  20.22
30.    6.94
   Gross Yield
April 23 2010
  1.    0.5
  2.    2.7
  3.    4.7
  4.    0.7
  5.    3.4
  6.    3.6
  7.    2.7
  8.    -
  9.    0.8
10.    3.1
11.    2.5
12.    0.9
13.    2.7
14.    3.8
15.    -
16.    1.6
17.    3.2
18.    1.3
19.    3.1
20.    2.6
21.    4.4
22.    3.5
23.    4.3
24.    4
25.    3.4
26.    3.5
27.    4
28.    8
29.    3
30.    1.2
   2 ,974.61 
April 30 2010
  1.    2.19
  2.    3.76
  3.    1.96
  4.   10.68
  5.    1.57
  6.  15.30
  7.    4.93
  8.    0.96
  9.    0.59
10.    5.35
11.  36.82
12.  21.16
13.  30.48
14.    9.84
15.    2.19
16.    3.03
17.    8.80
18.    2.63
19.    8.23
20.  15.20
21.    3.69
22.    2.28
23.    4.13
24.    3.18
25.    4.23
26.    4.26
27.    3.05
28.    2.34
29.  20.32
30.    6.97
   Gross Yield
April 30 2010
  1.    0.5
  2.    2.8
  3.    4.5
  4.    0.7
  5.    3.4
  6.    3.7
  7.    2.7
  8.    -
  9.    0.8
10.    3
11.    2.4
12.    0.9
13.    2.7
14.    3.9
15.    -
16.    1.7
17.    3.2
18.    1.3
19.    3.2
20.    2.6
21.    4.3
22.    3.4
23.    4.4
24.    4.2
25.    3.5
26.    3.5
27.    4.1
28.    8.1
29.    3
30.    1.1
Straits Times Index
Portfolio
  1. CapMallsAsia
  2. Capital Land
  3. CapitaMall
  4. CityDev
  5. ComforDelGro
  6. DBS Grp
  7. F & N
  8. Gent Intl
  9. Golder Agri
10. HK Land (USD)
11. JMH (USD)
12. JSH (USD)
13. Jardine C & C
14. Keppel Corp
15. NOL
16. Noble Grp
17. OCBC Bk
18. Olam
19. SGX
20. SIA
21. SIA Engg
22. SMRT
23. SPH
24. ST Engg
25. SembCorp Ind
26. SembMar
27. Singtel
28. Star Hub
29. UOB
30. Wilmar
    2 ,906.28
March 26 2010
  1.    2.30
  2.    4.03
  3.    1.84
  4.   10.76
  5.    1.59
  6.  14.60
  7.    4.66
  8.    0.92
  9.    0.545
10.    4.90
11.  34.20
12.  19.64
13.  29.20
14.    9.15
15.    1.94
16.    3.18
17.    8.71
18.    2.63
19.    7.85
20.  15.40
21.    3.56
22.    2.03
23.    3.79
24.    3.25
25.    4.00
26.    4.08
27.    3.20
28.    2.29
29.  19.48
30.    6.60
    Gross Yield
March 26 2010
  1.    0.4
  2.    2.6
  3.    4.8
  4.    0.7
  5.    3.3
  6.    3.8
  7.    2.9
  8.    -
  9.    0.9
10.    3.3
11.    2.6
12.    1
13.    2.8
14.    4.2
15.    -
16.    1.6
17.    3.2
18.    1.3
19.    3.3
20.    2.6
21.    4.5
22.    3.8
23.    4.7
24.    4.1
25.    3.8
26.    3.7
27.    3.9
28.    8.3
29.    3.1
30.    1.2
   2 ,943.02
April 01 2010
  1.    2.30
  2.    4.04
  3.    1.80
  4.   10.86
  5.    1.56
  6.  14.56
  7.    4.98
  8.    0.89
  9.    0.60
10.    5.07
11.  34.10
12.  20.08
13.  31.28
14.    9.44
15.    2.15
16.    3.06
17.    8.87
18.    2.60
19.    7.73
20.  15.52
21.    3.61
22.    2.05
23.    3.82
24.    3.26
25.    4.28
26.    4.29
27.    3.19
28.    2.36
29.  19.66
30.    6.88
   Gross Yield
April 01 2010
  1.    0.4
  2.    2.6
  3.    4.9
  4.    0.7
  5.    3.4
  6.    3.8
  7.    2.7
  8.    -
  9.    0.8
10.    3.2
11.    2.6
12.    1
13.    2.6
14.    4
15.    -
16.    1.7
17.    3.2
18.    1.3
19.    3.4
20.    2.6
21.    4.4
22.    3.8
23.    4.7
24.    4.1
25.    3.5
26.    3.5
27.    3.9
28.    8.1
29.    3.1
30.    1.2
    2 ,971.97
April 09 2010
  1.    2.32
  2.    4.07
  3.    1.81
  4.   11.40
  5.    1.56
  6.  14.68
  7.    4.90
  8.    0.90
  9.    0.61
10.    5.16
11.  35.00
12.  20.90
13.  30.24
14.    9.40
15.    2.16
16.    3.21
17.    8.93
18.    2.76
19.    7.89
20.  15.60
21.    3.66
22.    2.14
23.    3.97
24.    3.32
25.    4.21
26.    4.25
27.    3.16
28.    2.35
29.  19.84
30.    6.89
Gross Yield
April 09 2010
  1.    0.4
  2.    2.6
  3.    4.9
  4.    0.7
  5.    3.4
  6.    3.8
  7.    2.8
  8.    -
  9.    0.8
10.    3.1
11.    2.6
12.    1
13.    2.7
14.    4
15.    -
16.    1.6
17.    3.1
18.    1.3
19.    3.3
20.    2.6
21.    4.4
22.    3.6
23.    4.5
24.    4
25.    3.6
26.    3.5
27.    4
28.    8.1
29.    3
30.    1.2
Straits Times Index
Portfolio
  1. Capital Land
  2. CapitaMall
  3. CityDev
  4. ComforDelGro
  5. Cosco Corp
  6. DBS Grp
  7. F & N
  8. Gent Intl
  9. Golder Agri
10. HK Land (USD)
11. JMH (USD)
12. JSH (USD)
13. Jardine C & C
14. Keppel Corp
15. NOL
16. Noble Grp
17. OCBC Bk
18. Olam
19. SGX
20. SIA
21. SIA Engg
22. SMRT
23. SPH
24. ST Engg
25. SembCorp Ind
26. SembMar
27. Singtel
28. Star Hub
29. UOB
30. Wilmar
    2 ,790.29
March 5 2010
  1.    3.90
  2.    1.81
  3.   10.36
  4.    1.54
  5.    1.21
  6.  14.06
  7.    4.44
  8.    0.905
  9.    0.545
10.    4.80
11.  29.00
12.  17.08
13.  25.52
14.    8.50
15.    1.89
16.    3.26
17.    8.53
18.    2.49
19.    7.60
20.  15.90
21.    3.69
22.    1.96
23.    3.80
24.    3.12
25.    3.80
26.    3.89
27.    3.07
28.    2.19
29.  17.86
30.    6.63
    2 ,881.36
March 12 2010
  1.    3.93
  2.    1.84
  3.   10.46
  4.    1.57
  5.    1.23
  6.  14.30
  7.    4.48
  8.    0.93
  9.    0.565
10.    4.93
11.  33.40
12.  19.58
13.  27.26
14.    8.83
15.    1.97
16.    3.33
17.    8.88
18.    2.55
19.    7.88
20.  15.84
21.    3.67
22.    1.98
23.    3.80
24.    3.20
25.    3.94
26.    4.04
27.    3.14
28.    2.20
29.  18.70
30.    6.76
   2 ,915.70
March 19 2010
  1.    4.04
  2.    1.81
  3.   10.80
  4.    1.57
  5.    1.25
  6.  14.12
  7.    4.45
  8.    0.96
  9.    0.565
10.    4.93
11.  35.00
12.  19.80
13.  27.26
14.    9.02
15.    1.96
16.    3.43
17.    8.90
18.    2.61
19.    8.03
20.  15.44
21.    3.63
22.    2.02
23.    3.79
24.    3.29
25.    4.01
26.    3.94
27.    3.25
28.    2.28
29.  19.44
30.    6.60
 
Straits Times Index
Portfolio
  1. Capital Land
  2. CapitaMall
  3. CityDev
  4. ComforDelGro
  5. Cosco Corp
  6. DBS Grp
  7. F & N
  8. Gent Intl
  9. Golder Agri
10. HK Land (USD)
11. JMH (USD)
12. JSH (USD)
13. Jardine C & C
14. Keppel Corp
15. NOL
16. Noble Grp
17. OCBC Bk
18. Olam
19. SGX
20. SIA
21. SIA Engg
22. SMRT
23. SPH
24. ST Engg
25. SembCorp Ind
26. SembMar
27. Singtel
28. Star Hub
29. UOB
30. Wilmar
    2 ,683.56
February 5 2010
  1.    3.64
  2.    1.73
  3.   10.38
  4.    1.53
  5.    1.21
  6.  14.04
  7.    3.83
  8.    1.11
  9.    0.505
10.    4.45
11.  30.00
12.  17.00
13.  25.26
14.    8.18
15.    1.71
16.    2.76
17.    8.09
18.    2.28
19.    7.68
20.  14.10
21.    3.44
22.    1.86
23.    3.70
24.    3.16
25.    3.45
26.    3.37
27.    2.90
28.    2.13
29.  18.00
30.    6.11 
   2 ,758.90
February 12 2010
  1.    3.93
  2.    1.78
  3.   10.90
  4.    1.54
  5.    1.25
  6.  14.18
  7.    4.02
  8.    1.06
  9.    0.54
10.    4.65
11.  29.94
12.  16.92
13.  23.60
14.    8.34
15.    1.65
16.    2.97
17.    8.50
18.    2.54
19.    7.75
20.  14.34
21.    3.46
22.    1.90
23.    3.74
24.    3.25
25.    3.56
26.    3.43
27.    3.02
28.    2.10
29.  18.42
30.    6.28 
   2 ,757.14
February 19 2010
  1.    3.90
  2.    1.80
  3.   10.82
  4.    1.55
  5.    1.27
  6.  14.10
  7.    3.99
  8.    0.94
  9.    0.545
10.    4.65
11.  30.20
12.  17.06
13.  23.62
14.    8.39
15.    1.66
16.    2.96
17.    8.54
18.    2.47
19.    7.74
20.  14.68
21.    3.53
22.    1.93
23.    3.73
24.    3.10
25.    3.54
26.    3.37
27.    3.01
28.    2.13
29.  18.60
30.    6.39 
   2 ,750.86
February 26 2010
  1.    3.78
  2.    1.77
  3.   10.28
  4.    1.55
  5.    1.22
  6.  14.00
  7.    4.26
  8.    0.895
  9.    0.53
10.    4.60
11.  27.34
12.  16.50
13.  24.28
14.    8.41
15.    1.78
16.    3.17
17.    8.49
18.    2.43
19.    7.71
20.  14.88
21.    3.50
22.    1.96
23.    3.71
24.    3.13
25.    3.77
26.    3.71
27.    3.05
28.    2.14
29.  18.64
30.    6.50 

 
Straits Times Index
Portfolio
  1. Capital Land
  2. CapitaMall
  3. CityDev
  4. ComforDelGro
  5. Cosco Corp
  6. DBS Grp
  7. F & N
  8. Gent Intl
  9. Golder Agri
10. HK Land (USD)
11. JMH (USD)
12. JSH (USD)
13. Jardine C & C
14. Keppel Corp
15. NOL
16. Noble Grp
17. OCBC Bk
18. Olam
19. SGX
20. SIA
21. SIA Engg
22. SMRT
23. SPH
24. ST Engg
25. SembCorp Ind
26. SembMar
27. Singtel
28. Star Hub
29. UOB
30. Wilmar
    2,922.00
January 8 2010
  1.    4.24
  2.    1.87
  3.   11.64
  4.    1.63
  5.    1.31
  6.  15.38
  7.    4.41
  8.    1.24
  9.    0.605
10.    4.85
11.  30.58
12.  17.56
13.  26.48
14.    8.65
15.    1.78
16.    3.31
17.    8.91
18.    2.70
19.    8.40
20.  14.48
21.    3.68
22.    1.93
23.    3.61
24.    3.26
25.    3.70
26.    3.77
27.    3.05
28.    2.13
29.  19.92
30.    6.90 
   2,908.42
January 15 2010
  1.    4.28
  2.    1.84
  3.   11.66
  4.    1.63
  5.    1.33
  6.  15.14
  7.    4.49
  8.    1.25
  9.    0.57
10.    4.82
11.  30.84
12.  17.68
13.  26.62
14.    8.56
15.    1.91
16.    3.27
17.    8.80
18.    2.71
19.    8.34
20.  14.38
21.    3.56
22.    1.93
23.    3.80
24.    3.21
25.    3.69
26.    3.68
27.    3.01
28.    2.16
29.  19.42
30.    7.11
    2,819.71
January 22 2010
  1.    4.07
  2.    1.78
  3.   11.00
  4.    1.64
  5.    1.32
  6.  14.82
  7.    4.28
  8.    1.22
  9.    0.545
10.    4.66
11.  30.00
12.  17.52
13.  25.90
14.    8.23
15.    1.77
16.    3.07
17.    8.45
18.    2.52
19.    8.19
20.  14.18
21.    3.51
22.    1.89
23.    3.76
24.    3.26
25.    3.55
26.    3.56
27.    3.01
28.    2.15
29.  18.72
30.    6.66
   2 ,745.35
January 29 2010
  1.    3.86
  2.    1.69
  3.   10.72
  4.    1.59
  5.    1.26
  6.  14.28
  7.    4.16
  8.    1.06
  9.    0.52
10.    4.69
11.  30.00
12.  17.02
13.  25.30
14.    8.37
15.    1.73
16.    2.88
17.    8.19
18.    2.39
19.    7.99
20.  13.82
21.    3.34
22.    1.90
23.    3.70
24.    3.09
25.    3.53
26.    3.32
27.    3.01
28.    2.17
29.  18.16
30.    6.59 

See also; 
STI ETF - Exchange Trade Funds

How Can I Start Trading Stocks In S'pore

What Is Structured Deposit

Straits Times Index Stock Price Jan - Mar 2011

Straits Times Index Stock Price Sep - Dec 2010

Straits Times Index Stock Price May - Aug 2010

Straits Times Index Stock Price July - Dec 2009

Straits Times Index Stock Price Jan - June 2009

Straits Times Index Stock Price 2008

Straits Times Index Stock Price 2007

Main Menu : Singapore Stocks and Shares and SG Links Index

(c) www.gotothings.com All material on this site is Copyright.
Every effort is made to ensure the content integrity. Information used on this site is at your own risk.
All product names are trademarks of their respective companies.
The site www.gotothings.com is in no way affiliated with or endorsed by any company listed at this site.
Any unauthorised copying or mirroring is prohibited.