If you wish to invest in this SG ETF, it is better to known when is the good time to accumulate and when to take profits.
There are many hater of the STI ETF due to its poor performance. Likewise, it still have its supporters who prefer its twice yearly dividends and less volatility.
From the chart, we can see that Nikko AM STI ETF Performance is rather FLAT for more that 10 years. Therefore, if you intend to invest in this SG ETF, you should set 2 alerts, one to buy and then another to sell.
Buy Price
1st case: High Hit rate
To-date, the price to buy is at 3.05 which was hit once or twice a year.
2nd case: Lower Hit rate
2.60 to 2.75 only happens during stock market crash which can take 5 to 10 years for it to happened. From the chart, we can only see that happening 4 times.
Sell Price
1st case: High Hit rate
To-date the best price to sell is 3.40 which is once or twice a year.
2nd case: Lower Hit rate
3.45 to 3.50 only happens when the stock market is very bullish which can take 5 to 10 years for it to happened. From the chart, we can only see 6 peaks that had hit this high.
Dividends
Although Nikko AM STI ETF Performance is flat, it pays dividends twice yearly and after buying you can simply collect dividends and wait for the sell alert.
Conclusions
Basically, this is one of the passive way to invest and get paid while you wait for those who lack the time to monitor individual stocks. However, due to its flat performance, I don't think it is suitable for those who have decades ahead as time is at their side. To each their own investment strategy as win or lose, the money is yours.
Disclaimer: Past performance is not indicative of future results. Please Do Your Own Due Diligence (DYODD).
Updated with 2022 chart.
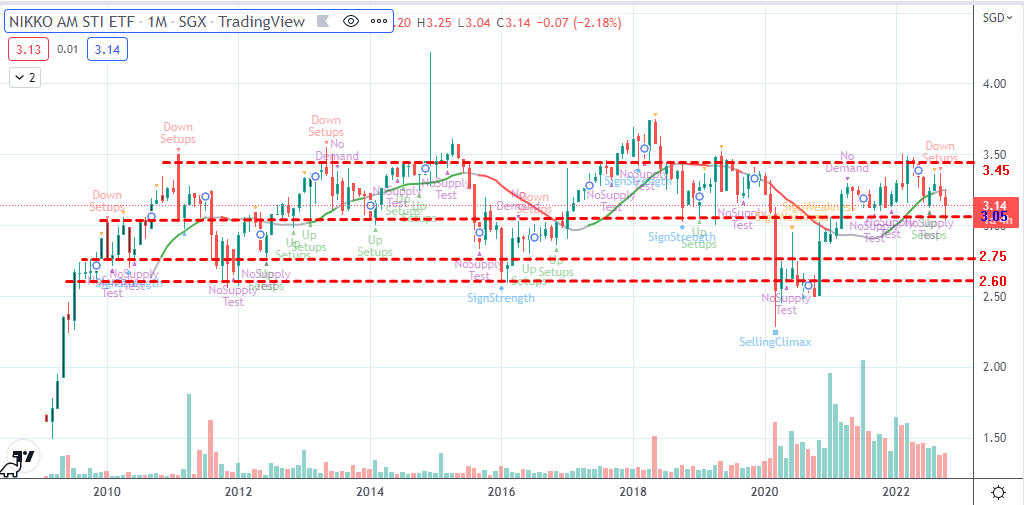
Chart Pattern
Analysis