Straits Times Index Stock Price July August September 2017

One Year High and Low

High 3,354.71 (July 27 2017)
         3,325.07 (July 19 2017)
         3,287.43 (July 14 2017)
         3,271.11 (May 11 2017)

Low  3,126.28 (April 19 2017)
         2,787.27 (November 14 2016)

Why I chose to invest for dividends?
The Reasons Why Dividend Stocks Make Great Investments

Investment Thoughts
Is Staying Away From The Stock Market Right

My Family Investing Strategy

2017 Strategy
Many once good dividends companies like Singpost, SPH, M1 and StarHub etc. are reducing their dividends payout.  This year, My Family Portfolio (since 2008) will be buying more Small and Medium size fundamentally good companies, Business Trusts and REITs that pay dividends.  My Family investment strategy is 10% trading and 90% long-term holding for dividends.

Date                    STI                     Volume                        STI ETF         Nikko STI ETF

Sep 29           3,219.91  -7.23    244 million shares traded       3.25                 3.35

Reading
Same Principles of Trading Success

Recent Sell
Raffles Medical (BSL) @ 1.135
Chip Eng Seng (C29 ) @ 0.77
Viva Ind Tr (T8B) @ 0.94

Recent Dividend
My Family Portfolio (since 2008) this week received dividend from Croesus RTrust, OUE and Frasers Logistic and Industrial.

Sep 22           3,220.25  +6.43   186 million shares traded       3.26                 3.35

Changes in STI as SIA Engineering (S59) had been replaced by JSH USD (J37).

Recent Buy
Mapletree Com Tr (N2IU) @ 1.515

Recent Dividend
My Family Portfolio (since 2008) this week received dividend from Kingsmen Creative, Far East H.Trust, Capitar China Trust, AimsAmp Cap and CDW.

Sep 15           3,209.56  -11.39   294 million shares traded      3.26                 3.35

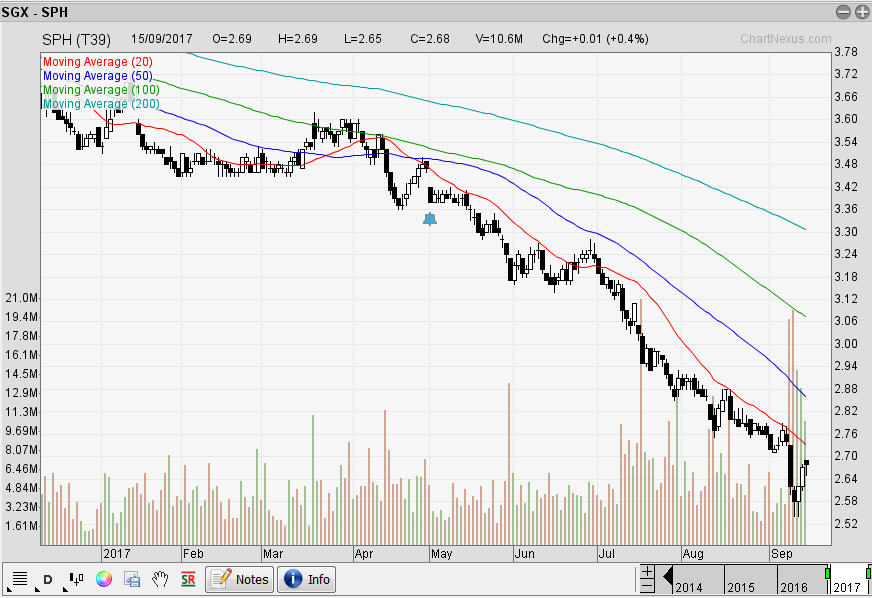
Before buying any shares, I find it useful to have a peek at the chart as I want to avoid buying shares that are in a downtrend.  SPH had been on a downtrend since October 2015, so your money would be stuck if you had invested in it as you would not know when the downtrend will stop.  This is often refer as a falling knife.


Recent Sell
ManulifeReit USD (BTOU) @ 0.96 

Recent Dividend
My Family Portfolio (since 2008) this week received dividend from Hong Leong Finance, CSE Global, Lee Metal, SingReInsurance, Centurion and IReit Global.

Sep 08           3,228.56  +0.50    191 million shares traded      3.26                 3.35

Recent Dividend
My Family Portfolio (since 2008) this week received dividend from S'pore O & G, OUE H.Trust, Haw Par, Nera Tel, Design Studio and Sarine Tech.

Aug 31          3,277.26  +12.00   417 million shares traded     3.32                 3.41

Recent Buy
Raffles Medical (BSL) @ 1.105 - Funds are buying and the current price give me an annual dividend of 1.8182%.  My next average price for RM will be @ 0.90.  The consensus target price by analyst is @ 1.304.  Aberdeen Asset Mgmt Asia Ltd continue averaging RM as it shares keep going down.  The latest buy on 24 Aug 2017 of 372,300 shares @ 1.137 made them one of the major holders at 5.02%.

Recent Dividend
My Family Portfolio (since 2008) this week received dividend from ComfortDelGro, First Reit, Viva Industrial Trust, Cache Logistic Trust, Mapletree Industrial Trust, SunTec Reit, St Engineering, StarHill Global Reit, SembCorp Marine, Frasers Commercial Trust, Lippo Malls Trust, Sheng Siong, Keppel Reit, Frasers Centrepoint Trust, Mapletree Com Trust, ISEC, Mapletree Logistic Trust, ESR Reit and SembCorp.

Aug 25          3,259.57  -12.59    172 million shares traded     3.31                 3.40

The stock market is being driven by two elements which is fear and greed. Many investors do not stick to their long term investment plans but rather base their decisions on ever changing price levels. Greed within the market is created when prices of particular stock increase rapidly whereas fear within the market is created when prices of a particular stock decrease rapidly. Warren Buffett, the genius of investments, does not succumb to these two emotions present within the world of stock market and rather rigorously follows his long term strategy. This is his key to success and therefore investors must remember that changing price levels are temporary and they can only result in greed and fear but not long term returns!

As not to be succumb to fear, will keep averaging ST Eng and Mapletree Com Trust if it keep going down.

Recent Buy
ST Engineering (S63) @ 3.57
Mapletree Com Tr (N2IU) @ 1.535

Recent Dividend
My Family Portfolio (since 2008) this week received dividend from GLP, SPH Reit, Vicom, Stamford Land, Parkway Life Reit, GP Industries, TalkMed, Old Chang Kee, Ascott Reit and CapitaCom Trust.

Aug 18          3,251.99  -16.89    231 million shares traded     3.29                 3.38

Taking profits out of TalkMed as it seems to be trending down like many other health care stocks.

Averaging Singapore O&G as the dividend is much better at current price.  Will average down again if it drop below 0.30 as the fundamental is still good but not market sentiment towards health care stocks.  Also, 2 of their doctors already start buying at the 0.40 cents range, so it make business sense for me to start averaging from this level onwards.

Company           Party                  Buy Sell  Transacted Price
Singapore O&G Heng Tung Lan  100,000      0.475 
Singapore O&G Beh Suan Tiong 100,000      0.477

For me, I always avoid non-dividend paying stocks as I don't wish to be paid nothing while waiting for the fundamental good stocks trend to change and move upwards.

Recent Buy
ST Engineering (S63) @ 3.58 and 3.60 (CPF)
Singapore O&G (1D8) @ 0.435
SPHREIT (SK6U) @ 0.99

Recent Sell
ParkwayLife Reit (C2PU) @ 2.73
TalkMed (5G3) @ 0.61

Recent Dividend
My Family Portfolio (since 2008) this week received dividend from Boustead S'pore, Bukit Sembawang, SoilBuildReit, Boustead Project, OCBC Bank and Keppel Infra Trust.

Aug 11          3,279.72  -43.52    311 million shares traded     3.30                 3.40

After 3 weeks of new 52 weeks high, the STI finally found the reason to go down with the news of increase tension cause by US and North Korea word of wars.  The situation had become worst due to North Korea repeated missile tests, including two successful intercontinental ballistic missile (ICBM) test launches in July. Those launches put the US mainland in range. Some experts believe the second missile could potentially reach New York.

This week, we can also see that the earning of the companies you hold drive the stock price:

  • City Development - 2nd quarter net profits fell by 17.9% - share price also fall
  • ST Engineering - 2nd quarter net profits fell by 12% - share price also fall
When the STI goes on technical correction, its time to buy some stocks again to be sold when STI went up again. 

Recent Buy
SIA Engineering (S59) @ 3.55 
Tuan Sing (T24) @ 0.345
StarhillGbl Reit (P40U) @ 0.76

Recent Dividend
My Family Portfolio (since 2008) this week received dividend from SIA Eng, Keppel Corp, M1 and SATS.

Aug 04          3,326.52  -16.40    225 million shares traded     3.35                 3.45

Property counter City Development (12.06), UOL (8.06),  CapitaLand (3.86) and Hong Kong Land (7.80) perform the strongest as they announced stronger result. 

Banks was also performing strongly beginning of the week until DBS warns of provisions for oil and gas portfolio could be higher which cause a little panic selling at the end of the week.

This week is a very good example where we can see that in the short-term, price will over-react based on positive or negative news.  The fundamental of a company you purchased is very important in the long-term as the price will always reflect the company earning power.

Recent Buy
SIA Engineering (S59) @ 3.57 (CPF)
Mapletree Com Tr (N2IU) @ 1.55
Mapletree Ind Tr (ME8U) @ 1.835

Recent Sell
ST Engineering (S63) @ 3.82
Teckwah (561) @ 0.515

Jul 28          3,330.75  -23.96    223 million shares traded     3.33                 3.42

STI hit record high for the 3rd week on 27 July 2017 at 3,354.17.  This week SPH hits another new 52 weeks low at 2.85.  On the other hand Singtel went up to 4.00 after the listing of NetLink NBN Trust as it is now flush with cash.  As market gets higher, I will continue to unload some of my shares.

Thank god that the dry dividend month for July is going to be over soon, looking forward to August where more companies will be paying dividends, yummy.  The dividend will be re-invested into the market so that the power for compounding can do its work.

Recent Buy
ESR-REIT (J91U) @ 0.565
NetLink NBN Tr (CJLU) @ 0.81 

Recent Sell
ST Engineering (S63) @ 3.79
Ascendas Reit (A17U) @ 2.73 (CPF)

Recent Dividend
My Family Portfolio (since 2008) this week received dividend from Silverlake Axis only.

Jul 21          3,314.12  +20.99   281 million shares traded     3.37                 3.42

STI this week hit another new high on 19 July at 3325.07. 

Usually, when the mood is good, I will slowly sell some of my stock each day as market hit higher high.  The selling risk is that I will miss out the higher profits but again, as I have learn before, market can suddenly turn and no one can catch the highest points. 

I will buy back when I feel fear again.  There is always a time to buy and a time to sell, you have to decide yourself when is yours.  Know your plan and execute them when the time come, do not hesitate and learn from your mistake and improve it as the market will always be there.

Recent Buy
Mapletree GCC Tr (RW0U) @ 1.62

Recent Sell
Keppel DC Reit (AJBU) @ 1.33
United Engineers (U04) @ 2.63
CapitaMall Trust (C38U) @ 2.01
GuocoLand (F17) @ 1.91 (CPF)

Jul 14          3,287.43  +51.76   424 million shares traded     3.32                 3.38

Surprise week as STI broke new 52 weeks high to 3,287.43

New 52 weeks low for SPH @ 3.03

Good news for GLP shareholders as a Chinese consortium Nesta Investment Holdings Limited has offered to take over GLP at the price of 3.38

Recent Sell
Micro-Mechanics (5DD) @ 1.28
STI ETF (ES3) @ 3.33

Jul 07          3,229.01  +2.67     188 million shares traded     3.27                 3.32

New 52 weeks low for SPH @ 3.14 and ComfortDelgro @ 2.20 - both stocks are in long-term down trend, avoid if you can.

One interesting news this week was about ComfortDelgro which encourage their drivers to take snapshots of uber or grab car drivers who pulls up at taxi stands and commit other offenses.  Since the penetrations of private hire car, ComfortDelGro taxi business have been going downhill and is no longer the big brothers as the private hire cars of uber and grab have outnumbered taxi at about 41,000 against 26,000 taxis.  The continue downhill of its share price shows that investor are waiting to see if ComfortDelGro can invest in other source of revenue to cover its 30% loss of its taxi business.

Recent Buy
Singapore O&G (1D8) @ 0.625
Straits Trading (S20) @ 2.40
ManulifeReit USD (BTOU) @ 0.905

Straits Times Index  Portfolio
  1. Ascendas Reit 
  2. CapitalCom Tr. 
  3. Capital Land
  4. CapitaMall Tr.
  5. CityDev
  6. ComforDelGro
  7. DBS Grp 
  8. Gent Intl 
  9. GLP 
10. Golder Agri 
11. HPH Trust USD 
12. HK Land (USD)
13. JMH USD
14. JSH USD
15. Jardine C n C 
16. Keppel Corp
17. OCBC Bk 
18. SATS 
19. SGX 
20. SIA 
21. SPH 
22. ST Engg 
23. SembCorp Ind
24. Singtel 
25. Star Hub 
26. Thai Beverage 
27. UOB 
28. UOL 
29. Wilmar 
30. YZL Shipbldg
     3,220.25
Sep 22  2017
  1.    2.67
  2.    1.67
  3.    3.61
  4.    2.05 
  5.  11.23
  6.    1.975
  7.  20.61
  8.    1.145 
  9.    3.29
10.    0.38
11.    0.45
12.    7.31
13.   64.40
14.   44.84
15.   39.25
16.    6.40 
17.  11.15
18.    4.65 
19.    7.44
20.  10.12
21.    2.72 
22.    3.51 
23.    2.95 
24.    3.68
25.    2.60 
26.    0.895 
27.  23.47
28.    8.07
29.    3.23
30.    1.41
   Gross Yield
Sep 22 2017
  1.    5.9
  2.    5.4
  3.    2.8
  4.    5.4
  5.    1.4
  6.    5.2
  7.    2.9
  8.    2.6
  9.    1.8
10.    1.7
11.    8.8
12.    2.6
13.    2.3
14.    0.7
15.    2.7
16.    3.1
17.    3.2
18.    3.7
19.    3.8
20.    2
21.    6.6
22.    4.3
23.    2.7
24.    4.8
25.    7.7
26.    2.6
27.    3
28.    1.9
29.    2
30.    2.8
   3,219.91 
Sep 29 2017
  1.    2.66
  2.    1.655
  3.    3.58
  4.    2.00 
  5.  11.33
  6.    2.08
  7.  20.82
  8.    1.17 
  9.    3.30
10.    0.375
11.    0.43
12.    7.20
13.   63.36
14.   43.20
15.   39.34
16.    6.49
17.  11.16
18.    4.61 
19.    7.39
20.  10.04
21.    2.72 
22.    3.44 
23.    2.96 
24.    3.68
25.    2.60 
26.    0.90 
27.  23.50
28.    8.12
29.    3.18
30.    1.43
   Gross Yield
Sep 29 2017
  1.    5.9
  2.    5.5
  3.    2.8
  4.    5.6
  5.    1.4
  6.    5
  7.    2.9
  8.    2.6
  9.    1.8
10.    1.7
11.    9.2
12.    2.6
13.    2.4
14.    0.7
15.    2.7
16.    3.1
17.    3.2
18.    3.7
19.    3.8
20.    2
21.    6.6
22.    4.4
23.    2.7
24.    4.8
25.    7.7
26.    2.6
27.    3
28.    1.8
29.    2
30.    2.8
   
Straits Times Index  Portfolio
  1. Ascendas Reit 
  2. CapitalCom Tr. 
  3. Capital Land
  4. CapitaMall Tr.
  5. CityDev
  6. ComforDelGro
  7. DBS Grp 
  8. Gent Intl 
  9. GLP 
10. Golder Agri 
11. HPH Trust USD 
12. HK Land (USD)
13. JMH USD
13. Jardine C n C 
14. Keppel Corp
15. OCBC Bk 
16. SATS 
17. SGX 
18. SIA 
19. SIA Engg 
20. SPH 
21. ST Engg 
22. SembCorp Ind
24. Singtel 
25. Star Hub 
26. Thai Beverage 
27. UOB 
28. UOL 
29. Wilmar 
30. YZL Shipbldg
     3,228.56
Sep 08  2017
  1.    2.72
  2.    1.725
  3.    3.70
  4.    2.11 
  5.  11.70
  6.    2.20
  7.  20.47
  8.    1.16 
  9.    3.27
10.    0.385
11.    0.46
12.    7.28
13.   66.00
13.   39.30
14.    6.27
15.   10.88 
16.    4.77
17.    7.43 
18.  10.18
19.    3.41
20.    2.74 
21.    3.59 
22.    2.94 
24.    3.68
25.    2.63 
26.    0.91 
27.  23.50
28.    8.08
29.    3.24
30.    1.41
   Gross Yield
Sep 08 2017
  1.    5.8
  2.    5.3
  3.    2.7
  4.    5.3
  5.    1.4
  6.    4.7
  7.    2.9
  8.    2.6
  9.    1.8
10.    1.7
11.    8.6
12.    2.6
13.    2.3
13.    2.7
14.    3.2
15.    3.3
16.    3.6
17.    3.8
18.    2
19.    4.1
20.    6.6
21.    4.2
22.    2.7
24.    4.8
25.    7.6
26.    2.6
27.    3
28.    1.9
29.    2
30.    2.8
   3,209.56
Sep 15  2017
  1.    2.70
  2.    1.70
  3.    3.64
  4.    2.07 
  5.  11.25
  6.    2.12
  7.  20.06
  8.    1.15 
  9.    3.29
10.    0.39
11.    0.465
12.    7.47
13.   65.66
13.   39.64
14.    6.24
15.   10.95 
16.    4.74
17.    7.42 
18.  10.13
19.    3.41
20.    2.68 
21.    3.53 
22.    2.92 
24.    3.67
25.    2.60 
26.    0.92 
27.  23.05
28.    7.98
29.    3.28
30.    1.42
   Gross Yield
Sep 15 2017
  1.    5.8
  2.    5.3
  3.    2.7
  4.    5.4
  5.    1.4
  6.    4.9
  7.    3
  8.    2.6
  9.    1.8
10.    1.6
11.    8.7
12.    2.5
13.    2.3
13.    2.7
14.    3.2
15.    3.3
16.    3.6
17.    3.8
18.    2
19.    4.1
20.    6.7
21.    4.2
22.    2.7
24.    4.8
25.    7.7
26.    2.6
27.    3
28.    1.9
29.    2
30.    2.8
   
Straits Times Index  Portfolio
  1. Ascendas Reit 
  2. CapitalCom Tr. 
  3. Capital Land
  4. CapitaMall Tr.
  5. CityDev
  6. ComforDelGro
  7. DBS Grp
  8. Gent Intl 
  9. GLP 
10. Golder Agri 
11. HPH Trust USD 
12. HK Land (USD)
13. JMH USD
13. Jardine C n C 
14. Keppel Corp
15. OCBC Bk 
16. SATS 
17. SGX 
18. SIA 
19. SIA Engg 
20. SPH 
21. ST Engg 
22. SembCorp Ind
24. Singtel 
25. Star Hub
26. Thai Beverage 
27. UOB 
28. UOL 
29. Wilmar 
30. YZL Shipbldg
     3,251.99
Aug 18  2017
  1.    2.64
  2.    1.745
  3.    3.75
  4.    2.13 
  5.  11.49
  6.    2.21
  7.  20.50
  8.    1.19 
  9.    3.22
10.    0.37
11.    0.425
12.    7.52
13.   65.20
13.   39.59
14.    6.33
15.   11.00 
16.    4.82
17.    7.40 
18.  10.32
19.    3.49
20.    2.80 
21.    3.56 
22.    2.98 
24.    3.75
25.    2.56 
26.    0.925 
27.  23.50
28.    8.19 
29.    3.13
30.    1.60
   Gross Yield
Aug 18 2017
  1.    6
  2.    5.2
  3.    2.7
  4.    5.2
  5.    1.4
  6.    4.7
  7.    2.9
  8.    2.5
  9.    1.9
10.    1.7
11.    9.3
12.    2.5
13.    2.3
13.    2.7
14.    3.2
15.    3.3
16.    3.5
17.    3.8
18.    1.9
19.    4
20.    6.4
21.    4.2
22.    2.7
24.    4.7
25.    7.8
26.    2.6
27.    3
28.    1.8
29.    2.1
30.    2.5
   3,259.57
Aug 25  2017
  1.    2.61
  2.    1.70
  3.    3.71
  4.    2.11 
  5.  11.38
  6.    2.28
  7.  20.43
  8.    1.19 
  9.    3.24
10.    0.385
11.    0.455
12.    7.40
13.   67.06
13.   40.23
14.    6.34
15.   10.98 
16.    4.81
17.    7.41 
18.  10.42
19.    3.48
20.    2.76 
21.    3.55 
22.    3.02 
24.    3.75
25.    2.66 
26.    0.935 
27.  23.59
28.    8.03
29.    3.22
30.    1.595
   Gross Yield
Aug 25 2017
  1.    6
  2.    5.3
  3.    2.7
  4.    5.3
  5.    1.4
  6.    4.5
  7.    2.9
  8.    2.5
  9.    1.9
10.    1.7
11.    8.7
12.    2.6
13.    2.2
13.    2.7
14.    3.2
15.    3.3
16.    3.5
17.    3.8
18.    1.9
19.    4
20.    6.5
21.    4.2
22.    2.6
24.    4.7
25.    7.5
26.    2.5
27.    3
28.    1.9
29.    2
30.    2.5
   3,277.26
Aug 31  2017
  1.    2.66
  2.    1.74
  3.    3.78
  4.    2.17 
  5.  11.71
  6.    2.29
  7.  20.62
  8.    1.185 
  9.    3.24
10.    0.395
11.    0.455
12.    7.41
13.   65.71
13.   39.93
14.    6.31
15.   11.17 
16.    4.83
17.    7.50 
18.  10.31
19.    3.52
20.    2.76 
21.    3.65 
22.    2.98 
24.    3.70
25.    2.61 
26.    0.93 
27.  24.03
28.    8.18
29.    3.32
30.    1.495
   Gross Yield
Aug 31 2017
  1.    5.9
  2.    5.2
  3.    2.6
  4.    5.1
  5.    1.4
  6.    4.5
  7.    2.9
  8.    2.5
  9.    1.9
10.    1.6
11.    8.7
12.    2.6
13.    2.3
13.    2.7
14.    3.2
15.    3.2
16.    3.5
17.    3.7
18.    1.9
19.    4
20.    6.5
21.    4.1
22.    2.7
24.    4.7
25.    7.7
26.    2.5
27.    2.9
28.    1.8
29.    2
30.    2.7
Straits Times Index  Portfolio
  1. Ascendas Reit 
  2. CapitalCom Tr. 
  3. Capital Land
  4. CapitaMall Tr.
  5. CityDev
  6. ComforDelGro
  7. DBS Grp 
  8. Gent Intl 
  9. GLP 
10. Golder Agri 
11. HPH Trust USD 
12. HK Land (USD)
13. JMH USD
13. Jardine C n C 
14. Keppel Corp
15. OCBC Bk 
16. SATS 
17. SGX 
18. SIA 
19. SIA Engg 
20. SPH 
21. ST Engg 
22. SembCorp Ind
24. Singtel 
25. Star Hub 
26. Thai Beverage 
27. UOB 
28. UOL 
29. Wilmar 
30. YZL Shipbldg
     3,330.75
Jul 28  2017
  1.    2.71
  2.    1.73
  3.    3.69
  4.    2.03 
  5.  11.28
  6.    2.29
  7.  21.68
  8.    1.15 
  9.    3.31
10.    0.39
11.    0.46
12.    7.56
13.   63.81
13.   40.28
14.    6.47
15.   11.39 
16.    4.83
17.    7.59 
18.  10.28
19.    3.62
20.    2.86 
21.    3.76 
22.    3.28 
24.    4.00
25.    2.72 
26.    0.95 
27.  24.05
28.    7.83 
29.    3.32
30.    1.305
   Gross Yield
Jul 28 2017
  1.    5.8
  2.    5.2
  3.    2.7
  4.    5.5
  5.    1.4
  6.    4.5
  7.    2.8
  8.    2.6
  9.    1.8
10.    1.6
11.    8.6
12.    2.5
13.    2.4
13.    2.7
14.    3.1
15.    3.2
16.    3.5
17.    3.7
18.    1.9
19.    3.9
20.    6.3
21.    4
22.    2.4
24.    4.4
25.    7.4
26.    2.5
27.    2.9
28.    1.9
29.    2
30.    3.1
   3,326.52
Aug 04  2017
  1.    2.67
  2.    1.71
  3.    3.86
  4.    2.02 
  5.  12.06
  6.    2.32
  7.  21.49
  8.    1.19 
  9.    3.26
10.    0.38
11.    0.47
12.    7.80
13.   64.00
13.   40.08
14.    6.40
15.   11.21 
16.    4.94
17.    7.58 
18.  10.53
19.    3.56
20.    2.88 
21.    3.81 
22.    3.18 
24.    3.83
25.    2.67 
26.    0.955 
27.  24.03
28.    8.06 
29.    3.42
30.    1.46
   Gross Yield
Aug 04 2017
  1.    5.8
  2.    5.2
  3.    2.7
  4.    5.5
  5.    1.4
  6.    4.5
  7.    2.8
  8.    2.6
  9.    1.8
10.    1.6
11.    8.6
12.    2.5
13.    2.4
13.    2.7
14.    3.1
15.    3.2
16.    3.5
17.    3.7
18.    1.9
19.    3.9
20.    6.3
21.    4
22.    2.4
24.    4.4
25.    7.4
26.    2.5
27.    2.9
28.    1.9
29.    2
30.    3.1
   3,326.52
Aug 11  2017
  1.    2.66
  2.    1.715
  3.    3.70
  4.    2.07 
  5.  11.14
  6.    2.31
  7.  20.80
  8.    1.155 
  9.    3.24
10.    0.375
11.    0.45
12.    7.34
13.   65.70
13.   40.02
14.    6.39
15.   11.20 
16.    4.77
17.    7.47 
18.  10.59
19.    3.52
20.    2.80 
21.    3.70 
22.    3.08 
24.    3.76
25.    2.56 
26.    0.93 
27.  24.20
28.    7.98 
29.    3.20
30.    1.53
   Gross Yield
Aug 11 2017
  1.    5.9
  2.    5.3
  3.    2.7
  4.    5.4
  5.    1.4
  6.    4.5
  7.    2.9
  8.    2.6
  9.    1.9
10.    1.7
11.    8.8
12.    2.6
13.    2.3
13.    2.7
14.    3.1
15.    3.2
16.    3.6
17.    3.7
18.    1.9
19.    4
20.    6.4
21.    4.1
22.    2.6
24.    4.7
25.    7.8
26.    2.5
27.    2.9
28.    1.9
29.    2
30.    2.6
Straits Times Index  Portfolio
  1. Ascendas Reit 
  2. CapitalCom Tr. 
  3. Capital Land
  4. CapitaMall Tr.
  5. CityDev
  6. ComforDelGro 
  7. DBS Grp 
  8. Gent Intl 
  9. GLP 
10. Golder Agri
11. HPH Trust USD 
12. HK Land (USD)
13. JMH USD
13. Jardine C n C 
14. Keppel Corp
15. OCBC Bk 
16. SATS 
17. SGX 
18. SIA 
19. SIA Engg 
20. SPH 
21. ST Engg 
22. SembCorp Ind
24. Singtel 
25. Star Hub 
26. Thai Beverage 
27. UOB 
28. UOL 
29. Wilmar 
30. YZL Shipbldg
     3,229.01
Jul 07  2017
  1.    2.60
  2.    1.695
  3.    3.49
  4.    1.955 
  5.  10.76
  6.    2.26
  7.  20.83
  8.    1.165 
  9.    2.85
10.    0.38
11.    0.45
12.    7.47
13.   64.95
13.   43.86
14.    6.38
15.   10.69 
16.    5.10
17.    7.36 
18.  10.03
19.    4.06
20.    3.13 
21.    3.64 
22.    3.15 
24.    3.86
25.    2.70 
26.    0.91 
27.  23.22
28.    7.51 
29.    3.34
30.    1.25
   Gross Yield
Jul 07 2017
  1.    6.1
  2.    5.4
  3.    2.9
  4.    5.7
  5.    1.5
  6.    4.6
  7.    2.9
  8.    2.8
  9.    2.1
10.    1.7
11.    8.8
12.    2.5
13.    2.3
13.    2.4
14.    3.1
15.    3.4
16.    3.3
17.    3.8
18.    2
19.    3.4
20.    5.8
21.    4.1
22.    2.5
24.    4.5
25.    7.4
26.    2.6
27.    3
28.    2
29.    1.9
30.    3.2
   3,287.43
Jul 14  2017
  1.    2.60
  2.    1.68
  3.    3.63
  4.    1.985 
  5.  10.94
  6.    2.28
  7.  21.10
  8.    1.08 
  9.    3.29
10.    0.385
11.    0.47
12.    7.55
13.   64.35
13.   43.60
14.    6.38
15.   11.05 
16.    5.02
17.    7.45 
18.  10.09
19.    4.06
20.    3.11 
21.    3.72 
22.    3.14 
24.    3.91
25.    2.74 
26.    0.915 
27.  23.85
28.    7.72 
29.    3.35
30.    1.295
   Gross Yield
Jul 14 2017
  1.    6.1
  2.    5.4
  3.    2.8
  4.    5.6
  5.    1.5
  6.    4.5
  7.    2.8
  8.    2.8
  9.    1.8
10.    1.7
11.    8.4
12.    2.5
13.    2.3
13.    2.5
14.    3.1
15.    3.3
16.    3.4
17.    3.8
18.    2
19.    3.4
20.    5.8
21.    4
22.    2.5
24.    4.5
25.    7.3
26.    2.6
27.    2.9
28.    1.9
29.    1.9
30.    3.1
   3,314.12
Jul 21  2017
  1.    2.68
  2.    1.75
  3.    3.74
  4.    2.03 
  5.  11.05
  6.    2.29
  7.  21.48
  8.    1.125 
  9.    3.32
10.    0.385
11.    0.45
12.    7.60
13.   63.67
13.   41.86
14.    6.58
15.   11.09 
16.    5.08
17.    7.51 
18.  10.26
19.    4.06
20.    2.98 
21.    3.77
22.    3.29 
24.    3.91
25.    2.74 
26.    0.93 
27.  23.98
28.    7.92 
29.    3.37
30.    1.345
   Gross Yield
Jul 21 2017
  1.    5.9
  2.    5.2
  3.    2.7
  4.    5.5
  5.    1.4
  6.    4.5
  7.    2.8
  8.    2.7
  9.    1.8
10.    1.7
11.    8.8
12.    2.5
13.    2.4
13.    2.6
14.    3
15.    3.2
16.    3.3
17.    3.7
18.    1.9
19.    3.4
20.    6
21.    4
22.    2.4
24.    4.5
25.    7.3
26.    2.5
27.    2.9
28.    1.9
29.    1.9
30.    3
See also; 

Millionaire Dividend Investor

How To Reduce Brokerage Fees

STI ETF - Exchange Trade Funds

How Can I Start Trading Stocks In S'pore

What Is Structured Deposit

Singapore Reits Investment

Straits Times Index Stock Price History

Credit Card That Saves You Money

Online Shop That Saves You Money

Ways To Earn Extra Income

Free UBER Ride for New User

Main Menu : The Averaging Dividend Investor

(c) www.gotothings.com All material on this site is Copyright.
Every effort is made to ensure the content integrity. Information used on this site is at your own risk.
All product names are trademarks of their respective companies.
The site www.gotothings.com is in no way affiliated with or endorsed by any company listed at this site.
Any unauthorised copying or mirroring is prohibited.