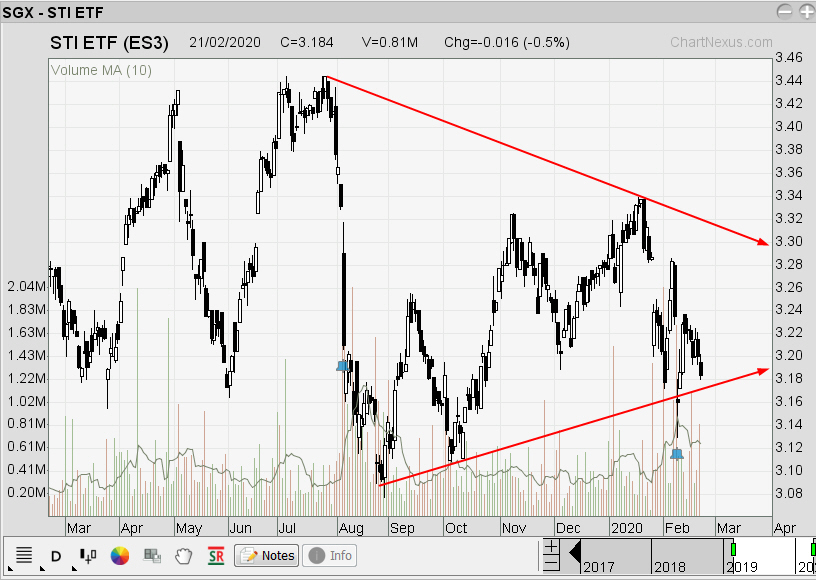
Symmetrical Triangle is a kind of
uncertainty as the upper price arrow is pointing downward while the lower
price arrow is pointing upward. Usually, we need to wait for the
smart moneys to confirm the direction before we trade the break up or down.
| Characteristic | Description |
| Two sloping and converging trendlines | Price follows two sloping trendlines that join at the triangle apex. |
| Price crossing | Price must cross the pattern from side to side, filling
the triangle withmovement. Avoid patterns
with excessive white space in the center of the triangle. |
| Volume | Volume in the pattern recedes and can be especially low the day before the breakout. |
| Breakout | Can be in any direction. |
| Duration | Should be longer than three weeks; otherwise they could be pennants. |
 ne
ne
Conclusion
Symmetrical Triangle keep traders in suspend as price keep getting narrower and narrower. The bulls and bears are equal in power and it test your patience as you need to wait for the breakout direction. The breakout often occurs around 70 to 75 percent of the way to the triangle apex. Symmetrical triangle less than 3 weeks long are considered pennants. Pennants like to rest upon a flagpole (a straight-line price run), so if the pole is missing, the pattern is a symmetrical triangle.
Singapore
Chart
Pattern
Analysis