Stock Price Trend
The longer the price trend leading to the start of a chart, the worse the performance. Go and check your favorite stock chart history to confirms this. Usually, those chart patterns with a short-term period (less than 3 months) from the start of the trend to the chart pattern gain an average of 40 percent after an upward breakout. Those with an intermediate-term trend (3 to 6 months) gain 37 percent and those with a long-term trend (over 6 months) gain just 27 percent. Take note that there are always exceptions and we should always think in term of the pareto principle, using the 80/20 rules.
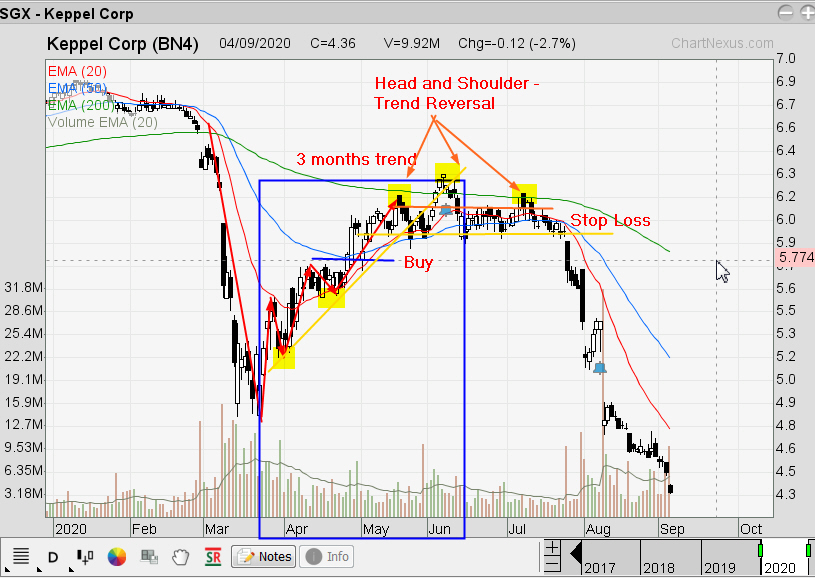
Keppel Corporation
Keppel Corporation start to trend up mid-March. The confirm buy signal only came around mid-May. Then the Head and Shoulder reversal pattern start to form in mid-July. This chart failure pattern start appearing after the 4th month. You can always buy back if the uptrend continues but think how much more you are going to lose further if you did not execute your stop loss with determination.
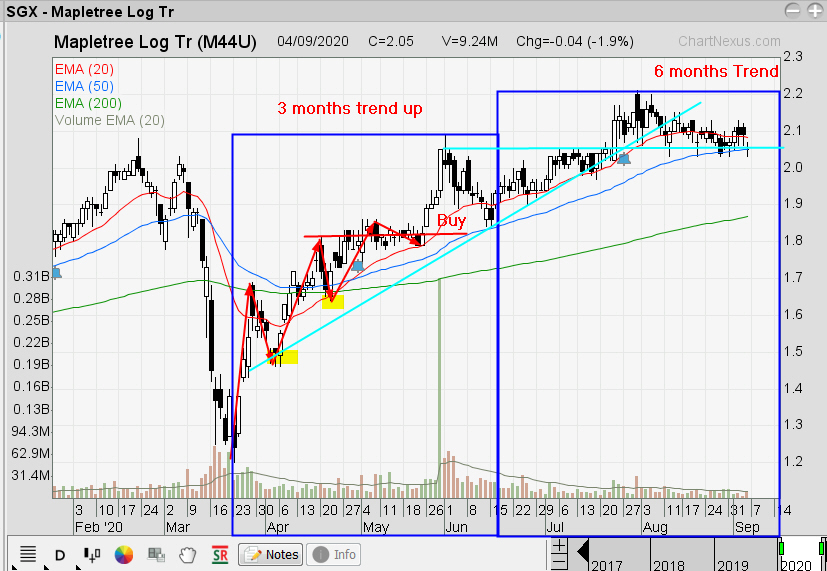
Mapletree Logistics Trust
Mapletree Logistics Trust uptrend are about 6 months long but you need to watch out for reversal pattern as the stock move sideways. Some stocks can be in an uptrend for a few years and you just have to keep a watch for any trend changes.
Conclusion
Remember, you would not drive a car if there are no brakes as you value your life. Likewise, you never execute a buy trade a stock if you can't determine your stop loss beforehand, that is, if you value your own money.
Singapore
Chart
Pattern
Analysis