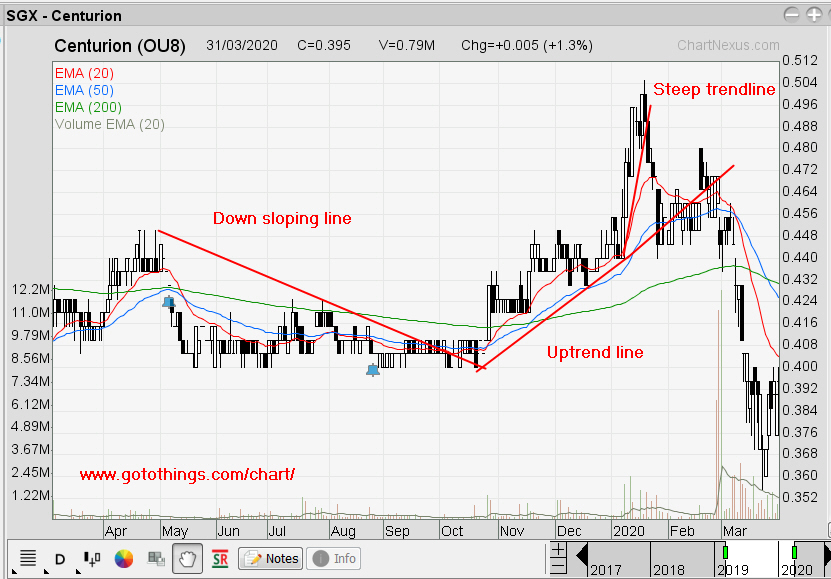
As you get more experiences with drawing trendlines, you may discover that steep up-sloping trendlines do not last very long.
I found Centurion having a good example of a steep trending line where it ends after 8 up bar. Why? Usually, many traders take profits when a stock rises too fast and furious. The herd selling pressure will force the stock to move sideways or down, piercing through the trendline, at least temporarily.
When trendline are out of the down sloping line, pay attention, as buying opportunities are in your favor.
Again when trendline start to move out of the uptrend line, pay attention as this mean that there is a higher probability that the uptrend is ending and you should be taking some or all profits.
There are trader who like to use the 20 and 50 EMA to guide them. When the 20 EMA is above the 50 EMA and uptrend line, there is a 60% chance that the trend will continue doing what is doing, and that is to go up. Same goes for the downtrend line where the 20 will stay below the 50 EMA and downtrend line.
 he
he
Conclusion
Trendlines act as a guide for our eyes and enable trader to buy or sell at the most favorable price line with more confidence.
Singapore
Chart
Pattern
Analysis