Imagine that others acted in the same way as my friend. Their emotional selling would cause the stock price to go down. Retail investors who bought the stocks just before the drop or as the selling begins also get upset as they saw their price tumbles. They vowed to sell when the stock price goes back to their buy price as the just want to get their money back.
If you were to plot this emotional behavior on a chart, you would see the stock price peak and then peak again near the same price. That kind of concerted selling forms a barrier to upward movement called overhead resistance. Eventually, price will eat through that resistance, as it is not made of concrete.
Another similar emotional behavior is that a retail investor want to buy a stock a 0.35, but price gap higher and zooms away from them, rising to 0.45. So they missed the move and vow to buy the stock if it ever gets back to 0.35. When the stock drops to 0.35, they quickly buy, joining others doing the same thing. That kind of buying demand builds a floor underneath the stock, which we call support. As the floor is not made of concrete either, so price can act as termites do and eat its way through, this is what we call break support.
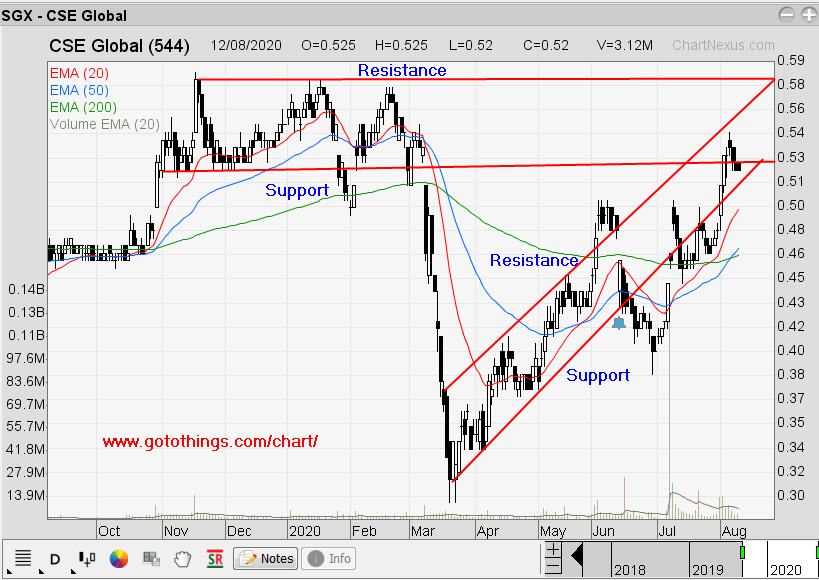
This CSE Global chart shows 2 example of support and resistance. Stocks price can goes up, sideways or down, likewise, there are 3 types of support and resistance which you need to pay attention to.
Take note that once broken, support areas can act as resistance and resistance areas can act as support.
Conclusion
Technical traders follow the rules of support and resistance and when it fails, we squeal like a stuck pig. Nevertheless, support and resistance serve as a great guide as price bounce up down the upper and lower walls and gave you the opportunities to do short-term buy and sell.
Singapore
Chart
Pattern
Analysis