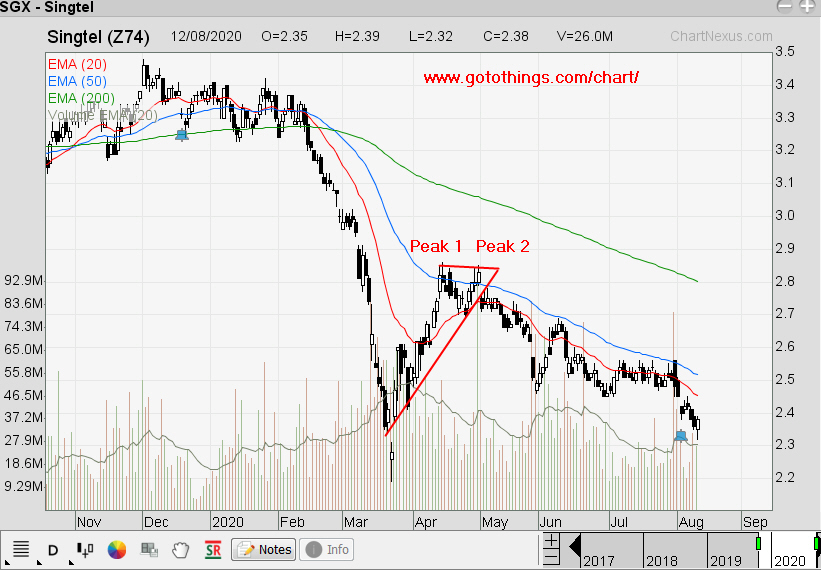
Whenever price test the Peak 1, pay attention to the next bar, if after 3 or more bars and there are no gap up or power up bar, most likely price will fall back below the Peak 1.
When Peak 2 start to form, it resemble the double top. Double top is a popular reversal pattern.
An example here is the Singtel chart where a double top was form and then it start sliding down.
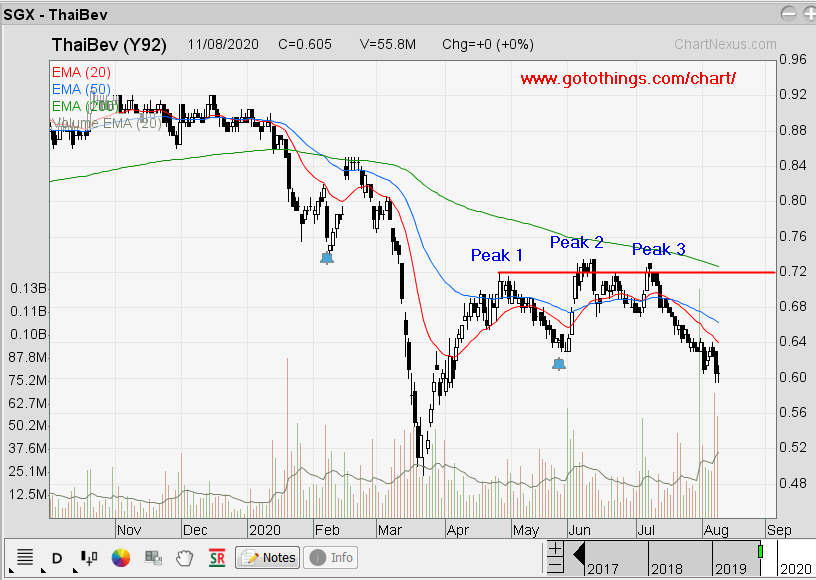
When Peak 3 form, it resemble the triple top and if price action still does not gap or power up, there is a 70% chance that price will reverse and break support.
The more times price test the same resistance line, the weaker it becomes and the bears see this as a weakness and will start to short the stock.
Look at ThaiBev, when price pull back from Peak 3, the triple top reversal pattern took effect and the bears managed to push the price down and break support.
Conclusion
There are no specific rules that say price will fall when a double or triple top were form. Sometimes, there may be 5 tops before price start to fall. No hard rules in technical trading, just trade what you see.
Singapore
Chart
Pattern
Analysis