One Year High and Low
High 3,539.95 (April 15 2015)
Low 2,532.70 (January 21 2016)
Why I chose to invest for dividends?
The
Reasons Why Dividend Stocks Make Great Investments
Date STI Volume STI ETF Nikko STI ETF
March 24 2,847.39 -34.59 231 million shares traded 2.85 2.90
As oil drops below US$40, it slide some points off the STI.
This week Noble had been drop off from STI and was replaced by CapitaCom Trust.
Share Buy Back by STI companies
OCBC
200,000 @ 9.17
SIA Engineering 28,700 @ 3.59
March 18 2,906.80 +26.63 425 million shares traded 2.91 2.96
Good news for investor this week as STI recoups losses of January bloodbath. Again, it is a good reminder that dividend investors should focus on the fundamental of companies rather than following this nonsensical news that bring the prices up and down.
Recent Purchase
SingReinsurance (S49) @ 0.315
Recent Dividend
My Family Portfolio (since 2008) this week received dividend from Lippo
Mall, Tai Sin Electric.
March 11 2,828.86 +19.74 253 million shares traded 2.83 2.88
STI went up as the ECB had unveiled stimulus measures that were more aggressive than expected, including expanding the size of bond purchases by 20 billion euro to 80 billion euro per month starting next month and slashing three key interest rates.
Oil Prices
Good news for oil price as Goldman Sachs says that the oil markets may be starting to rebalance as the US output shows signs of falling and output in Nigeria and Kurdistan is disrupted, potentially cutting global oversupply.
Recent Dividend
My Family Portfolio (since 2008) this week received dividend from Silverlake
Axis, Lum Chang.
March 4 2,837.38 +49.38 532 million shares traded 2.84 2.90
Another week of mini-rally due to better news as the US economy seems stronger and Brent crude prices seems to be staying steady at the US$36 a barrel. Wah lau, good news bad news causes the stock market to rise or fall again.
Oil Prices
After 2 bad years of falling, shale oil producers in the US have started cutting back their output as they face earning losses and the reality that a supply glut is the main reason behind the extended slump in oil prices. Just wondering, if the global economy and stock market crises was cause by the falling oil prices, the US can stop all shale oil producers from producing oil so that oil prices will rise again and so will the global economy and stock market.
Dividend Shares Trading
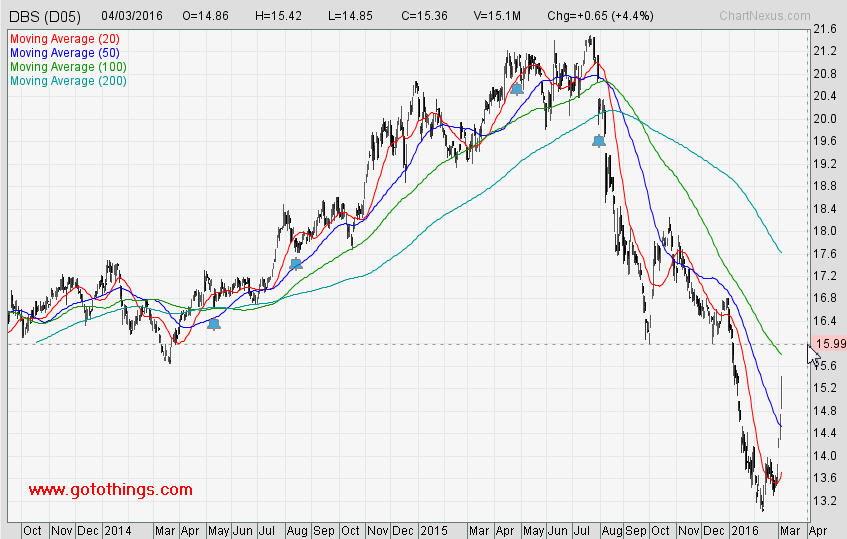
Sold my 500 shares of DBS during last week 4 days rally at 15.35 (bought at 13.22).
If we ignore 26 Feb 2016 which had a 1 cents difference, DBS had
already raise up 2.01 (15.36 - 13.35 = 2.01) within a short period of 1
week. In technical trading, we had to assume that the resistance
is around 16 and support to be around 14. That's the difficult part
of technical trading, we made assumption. Anyway, its dividend
trading for fun and got profit can already.
| Date | Open | High | Low | Close | Volume |
| 4 Mar 2016 | 14.86 | 15.42 | 14.85 | 15.36 | 15,107,000 |
| 3 Mar 2016 | 14.30 | 14.75 | 14.30 | 14.71 | 14,440,500 |
| 2 Mar 2016 | 14.22 | 14.31 | 14.15 | 14.24 | 16,020,100 |
| 1 Mar 2016 | 13.61 | 13.85 | 13.52 | 13.84 | 20,218,300 |
| 29 Feb 2016 | 13.62 | 13.62 | 13.47 | 13.58 | 7,215,400 |
| 26 Feb 2016 | 13.50 | 13.65 | 13.45 | 13.59 | 6,242,500 |
| 25 Feb 2016 | 13.57 | 13.58 | 13.30 | 13.35 | 9,755,300 |
Recent Dividend
My Family Portfolio (since 2008) this week received dividend from Singpost.
February 26 2,649.38 +45.98 294 million shares traded 2.66 2.72
Friday mini-rally due to China regulators who seems willing to sustain growth with more monetary easing.
Good news for DBS Group as CEO buys $2.8 m in own company stock. As per SGX filing, Mr Gupta bought 200,000 DBS shares on Monday at 13.88. He also commented that the market panic is overdone as this is not a Lehman kind of crises. I do agree what he says, but a stock market crises is a crises, and investors tends to panic during such crises and sell no matter what you say as many investors just look at stock as prices but forgot that there are real businesses running behind beside that stock price ticker.
Recent Dividend
My Family Portfolio (since 2008) this week received dividend from SoildBizReit,
KepReit, OUE HT, Parkway Life Reit, SunTec Reit.
February 19 2,656.87 -0.70 273 million shares traded 2.68 2.72
My DBS Group Volatile Experience
Bought my 1st 500 shares of DBS Group on 11 Feb 2016 at the price of 13.22
| Date | Closing Price | Remark |
| 11 Feb 2016 | 13.14 | I lose money - feeling down |
| 12 Feb 2016 | 13.02 | I lose money |
| 15 Feb 2016 | 13.41 | I win money - feeling good, thought of selling for some profits |
| 16 Feb 2016 | 13.68 | I win money - price went higher, think can hold for higher price |
| 17 Feb 2016 | 13.60 | Still win money although it went down by 8 cents - feeling indecisive |
| 18 Feb 2016 | 13.89 | I win money - went up further, nice profits if I sell now |
Recent Dividend
My Family Portfolio (since 2008) this week received dividend from BRC
Asia, K1 Venture, Fraser and Neave, Keppel Infrastructure Trust.
February 12 2,539.95 +1.67 330 million shares traded 2.56 2.61
The Fear of 2016
Since the beginning of 2016, the financial markets had been driven
by tumbling commodity prices, fears over China growth and its volatile
exchange rate policy and concerns about the ability of central banks to
continue propping up growth. Investors are also worry that growth
in the United States is faltering at a time when the Fed has begun raising
interest rates, fears of escalating Saudi-Iranian conflict and the endless
plummeting oil prices together with the severe weakness in global demand.
Besides that, they also fear the rise in the leverage of US energy firms
and fragile sovereigns in oil-exporting economies which strike the fear
of serious credit default. Adding on are the fear of never-ending
worries about Europe, with a British exit from the European Union becoming
more likely. With so much fear in the market, no wonder there are
so many fearful investors who rather sell their shares then see them getting
lower and lower each month of 2016.
Recent Purchase
DBS Group (D05) @ 13.22
No dividends receive for this week.
February 5 2,623.21 +64.72
362 million shares traded 2.63
2.68
Hopes of deferred Fed interest hike have somehow lift sentiments and
resulted in the STI gaining 64.72 points. So, will hopes continue
to propel the STI higher next week?
Dr Chan who wrote about Financial crocodiles, a term used to describing very powerful and aggressive people in the financial world warn small investors against following people such as George Soros. Financial crocodiles have deep pockets to move the stock markets and make use of news of hope or fear to trigger the markets in their desired direction. For the small investors, it's best you divest your money into blue chips which are fundamental strong and had been consistently paying dividends for the last 10 years. Some example of STI dividends paying stocks:
| Ascendasreit (A17U) | OCBC Bk (O39) | SIA Engg (S59) |
| Calculated using
last done price (2.39) on date (2/5/2016) |
Calculated using
last done price (7.69) on date (2/5/2016) |
Calculated using
last done price (3.48) on date (2/5/2016) |
| Year Dividend % | Year Dividend % | Year Dividend % |
| 2015 0.15301 6.4021
2014 0.1439 6.0209 2013 0.1383 5.7866 2012 0.1404 5.8745 2011 0.1314 5.4979 2010 0.1267 5.3013 2009 0.1438 6.0167 2008 0.1515 6.3389 2007 0.1338 5.5983 2006 0.1206 5.046 |
2015 0.36 4.6814
2014 0.35 4.5514 2013 0.34 4.4213 2012 0.31 4.0312 2011 0.3 3.9012 2010 0.29 3.7711 2009 0.28 3.6411 2008 0.28 3.6411 2007 0.26 3.381 2006 0.23 2.9909 |
2015 0.145 4.1667
2014 0.24 6.8966 2013 0.22 6.3218 2012 0.22 6.3218 2011 0.3 8.6207 2010 0.19 5.4598 2009 0.16 4.5977 2008 0.21 6.0345 2007 0.12 3.4483 2006 0.3 8.6207 |
My Family Portfolio (since 2008) this week received dividend from SGX.
January 29 2,629.11 +66.66
415 million shares traded 2.63
2.68
Interesting end of the week news where the surprise move by the Bank
of Japan actually sparks a rally when it cuts its interest rate to below
zero (-0.1 per cent).
Smart Singaporean
There was an article on the Friday Today about Students, retirees scavenge
stock market for bargains. Some students and retirees with a keen
eye for cheap bargains have gone shopping but not at the department store
or supermarket. Some interesting highlights shows there are opportunities
seekers who had taken advantage of the recent good fundamental stocks which
had been battered badly.
- Madam Sally Ng, 66, a retiree, bought four lots of OCBC shares because she felt it was a good opportunity to buy into the bank.
- Ms Uma Aruchanan, 22 a student, is looking to add to her current banking portfolio of UOB and DBS shares.
- Other sectors that have seen activity are the healthcare and consumer goods sectors. They are more resilient in times of market turmoil, said Mr Mattar.
I bought Keppel Corporation at the price of 10.73 and this week it closes at 5.02, which means I lost 50% of my investment value. Infact, many investors had underestimate the oil crises impact on those oil rigs companies like SembCorp and SembMarine. Nevertheless, this oil crises show us the important of diversification. Keppel Corporation is a very large conglomerate and many investors had forgotten the Lehman Brothers collapse where even large companies can be bought down to its knee during a economic crises.
Lesson Learned
The investment losses from Keppel Corporation also shows that the dividend
investment route is not always a bed of roses. However, my overall
portfolio of dividend stocks had somehow soften the blow. It also
shows the important of not putting all your dividend to be dependent on
a few single stocks or industry sectors. My dividend stocks experience
still shows that this is a viable investment strategy (at least for myself)
if we walk with care and be selective in our dividend stocks selection.
No matter what strategy you chose, there are no failure proof investment
strategy. We just have to learned again, save again, invest again
and keep moving forward again.
Recent Dividend
My Family Portfolio (since 2008) this week received dividend from Boustead
Singapore.
January 22 2,577.76 +44.39
393 million shares traded 2.65
2.64
Very volatile week as we see the market see-sawing up and down.
Finally closing the week with positive sentiments as the European Central
Bank hinted that it may bolster economic support in the coming months.
What lau, down, down, up, down, up, no wonder they say only 5% of the smart
traders can earn money from the other 95%.
21 Jan 2016 2,581.11 Down again due to removal
of Iran sanctions and negative impact on oil prices
20 Jan 2016 2,612.53 Up due to China Stimulus
19 Jan 2016 2,585.99 Down again as oil strike
a new lows of 28 USD per barrel
18 Jan 2016 2,593.60 Down cause by oil continue
falls and China worries
Recent Purchase
SPH (T39) @ 3.51 (using CPF)
No dividends receive for this week.
January 15 2,630.76 -13.81
264 million shares traded 2.69
2.69
The oil price drop to new low and China economics problems continue
to bug the Singapore stock market. I can see many bargain emerging
and once my money is in, I will continue to buy. If you missed this
Great Singapore Stocks sales, you may need to wait another 8 to 10 years,
so open your eyes and hunt down those blue chips companies which you have
been eyeing and start averaging your purchases as the sales can end any
time with a vengeance. However, I will avoid the gas and oil industry
which are companies like Keppel Corporation, Sembawang Corporation and
Sembawang Marine.
Recent Dividend
My Family Portfolio (since 2008) this week received dividend from Singtel,
A-Reits.
January 8 2,751.23 +21.32
462 million shares traded 2.81
2.81
Bad start for 2016 as market plunge due to the China bearish sentiment.
The market large drop beginning of this week were caused by:
1) The auto trading halt cause the chinese stocks to nose-dived on Thursday,
triggering the second day long trading halt of the week and sending share
markets, currencies and oil prices lower as investor jitters rippled across
Asia. There was some apparent panic selling with investors trying
to reduce exposure before the mandatory triggers entered into effect.
2) Then come another slump after China's government guided the yuan
sharply lower, in a sign that authorities are prepared to weaken the tightly
controlled currency to boost flagging exports.
Fortunately, the STI recovers after China lifts the circuit breaker.
No dividends receive for this week.
Recent Purchase
SPH (T39) @ 3.77